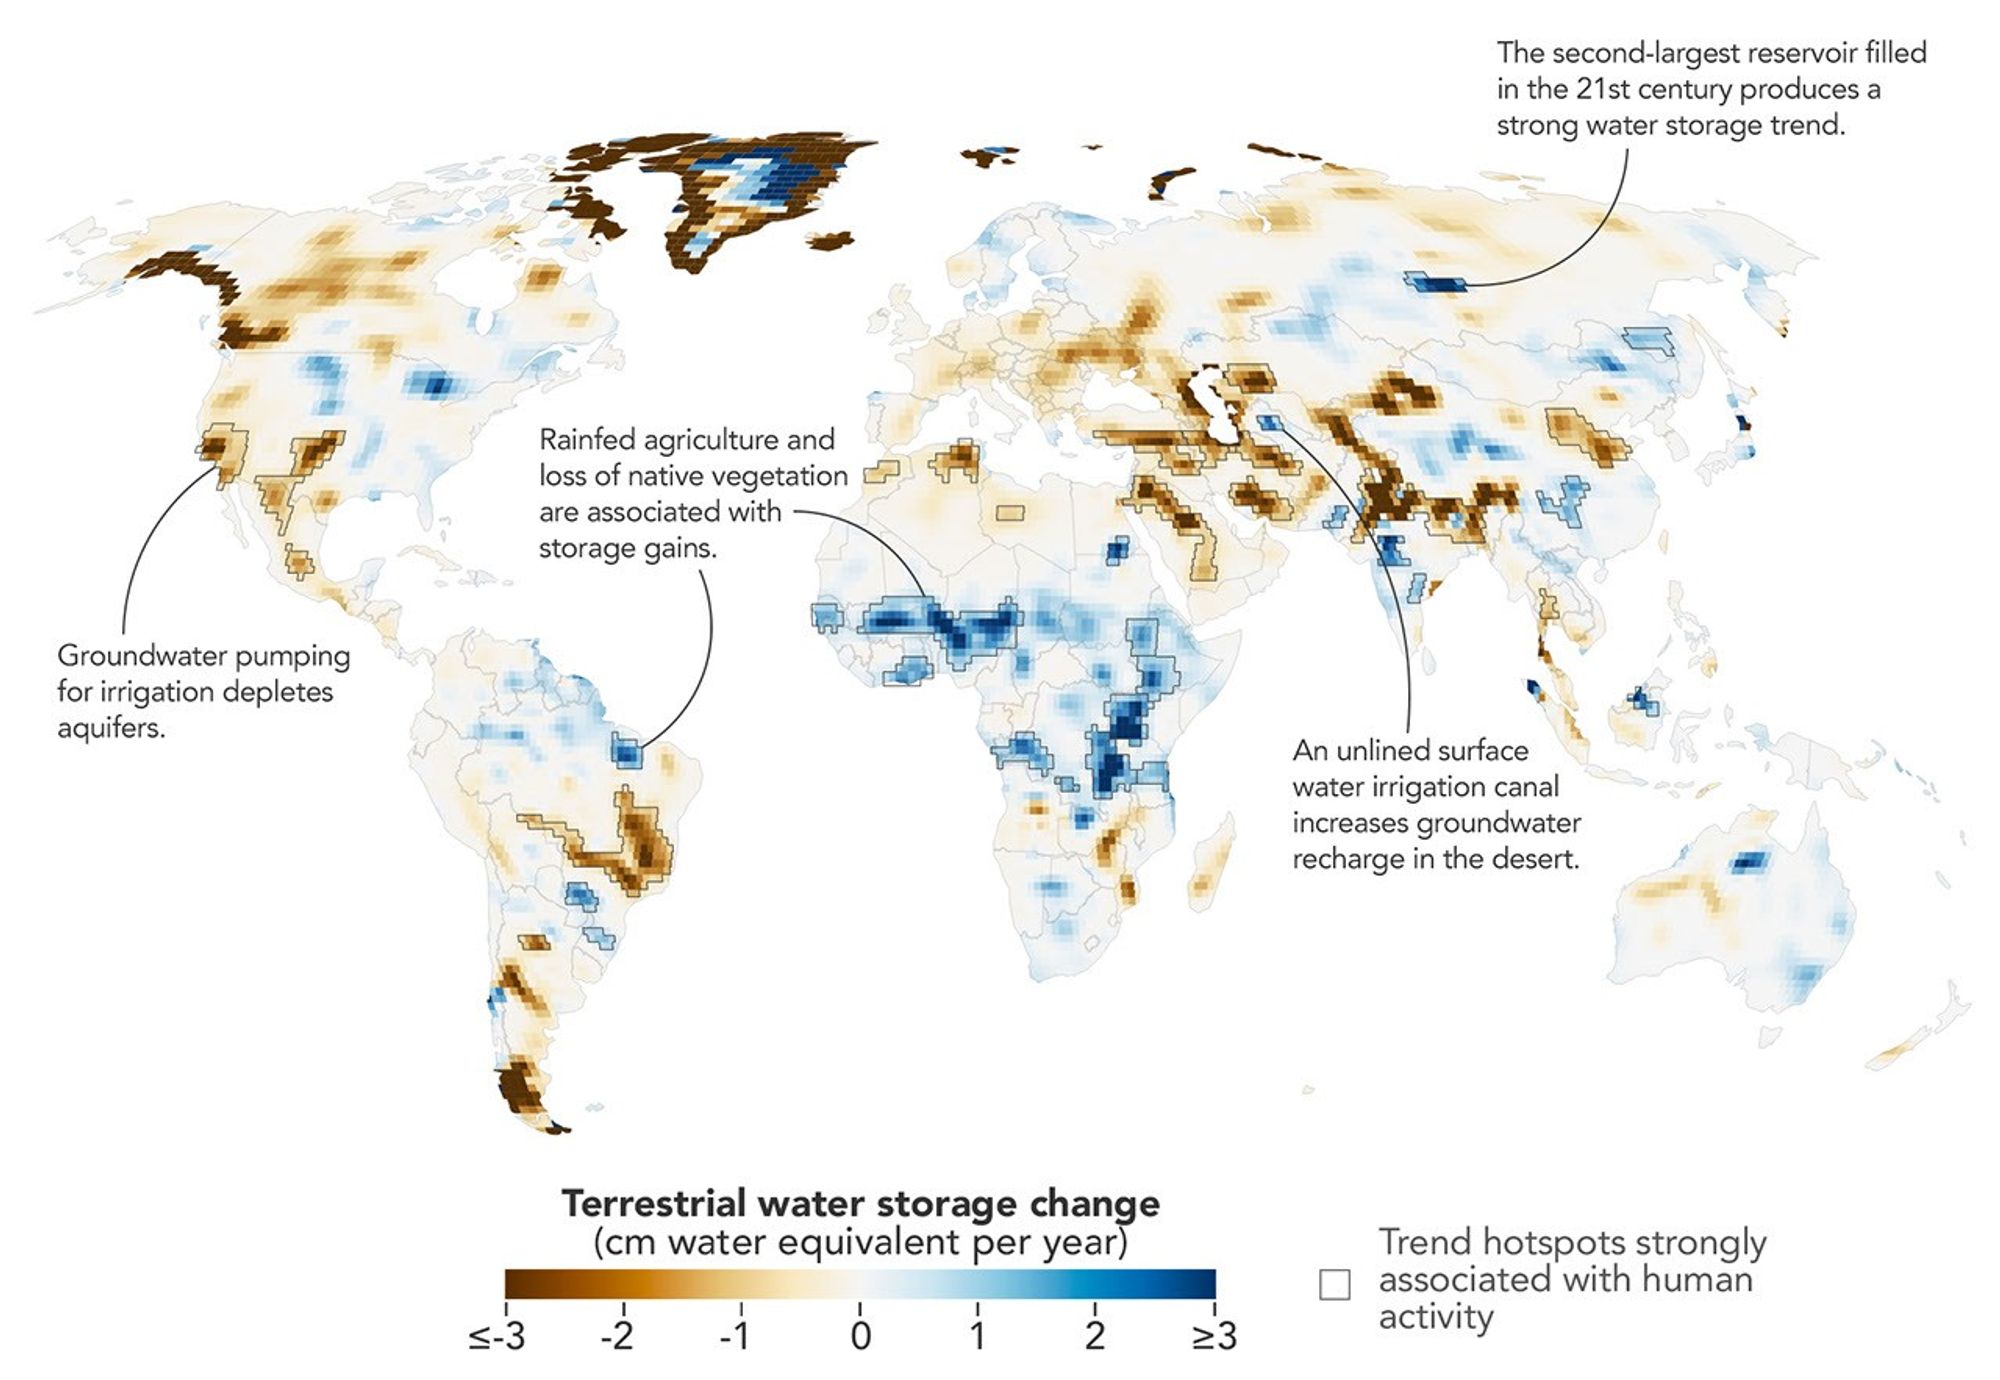
A NASA-led analysis of GRACE satellite gravity data maps land water storage changes at higher resolution and identifies 40 regions where human activity drives trends.
Human influence is increasingly visible in the way water is stored and moved across Earth’s continents, and a new NASA-led analysis pinpoints where that fingerprint is strongest. By examining more than 20 years of satellite observations that detect tiny shifts in the planet’s gravity, researchers produced a detailed picture of how terrestrial water storage—the combined water held in rivers and lakes, soil moisture, snow and ice, and groundwater—has changed from April 2002 through November 2025.
The team’s map captures broad gains and losses in land water storage over that period, but the study goes further than climate alone. After accounting for natural climate variability, the scientists identified 40 regions where water-storage trends also tracked closely with human activities including irrigation, reservoir building and filling, and land-use change. Those human-linked relationships appeared on every nonpolar continent except Australia.
In several places, human factors were not just contributing—they were dominant. “In four continental regions, an anthropogenic variable showed a stronger relationship with the storage trends than any climate variable did,” said Mary Michael O’Neill, a hydrologist at NASA’s Goddard Space Flight Center and the study’s lead author. Among the most prominent examples were California’s Central Valley and northern India, where intensive groundwater pumping for agriculture has been linked to major declines in water storage. In northern India, the refined approach suggests the drawdown has been happening faster than earlier estimates indicated.
The results rest on data from the Gravity Recovery and Climate Experiment (GRACE) mission and its successor, GRACE Follow-On (GRACE-FO). Each mission flies a pair of satellites in close formation. When the leading spacecraft passes over a region with slightly more mass—often due to extra water or ice—the local gravitational pull changes minutely, altering the distance between the two satellites. Instruments measure those distance variations with extreme precision, allowing scientists to infer where mass on the ground has increased or decreased. Because water is heavy and constantly shifting, GRACE observations can be translated into changes in land water storage.
Traditionally, GRACE data are delivered as monthly maps that highlight large-scale patterns. But because the satellites have repeatedly traversed most of the globe over more than two decades, the researchers combined many individual overpasses to extract long-term trends at much finer spatial scales—about five to ten times sharper than many earlier assessments. The tradeoff was less detail about month-to-month variations.
With those higher-resolution trend maps in hand, the researchers applied statistical methods to evaluate how strongly different climatic and human variables aligned with observed changes, and to locate where human activity likely played a role. According to study co-author Matthew Rodell, deputy director for Earth Sciences for Hydrosphere, Biosphere, and Geophysics at NASA Goddard, the enhanced resolution revealed impacts that previous analyses missed and indicated that some already-known trends are more intense than believed.
Across multiple continents, the strongest association with declining terrestrial water storage was groundwater-irrigated agriculture. In North America, the pattern appeared in California’s Central Valley, the southern High Plains of the United States, and the Mexican state of Chihuahua—areas where persistent drought has pushed growers to rely more heavily on groundwater. The analysis also reinforced the central role of pumping in northern India’s losses, while finding that retreating Himalayan glaciers explain only about 15% of the decline there, consistent with earlier work.
Not all human-driven change pointed toward depletion. In parts of sub-Saharan Africa, the study detected water-storage increases in places where rainfed cropland expanded. In those regions, native savanna gave way to millet cultivation during the study period, and groundwater levels rose even though rainfall was below average. Researchers saw a comparable signal in Brazil’s northern state of Maranhão, where expanding soybean agriculture has replaced earlier landscapes.
Why it matters
Water stored on land is the buffer that communities, farms, and ecosystems draw on during dry spells—and the new analysis shows that human decisions can outweigh climate signals in key regions. The findings sharpen where groundwater stress is most severe and where land-use change is altering recharge, which affects water security, food production, and long-term planning. Next to watch is whether regional policies on pumping, irrigation, and land management can slow depletion in hotspots and avoid unintended shifts elsewhere.