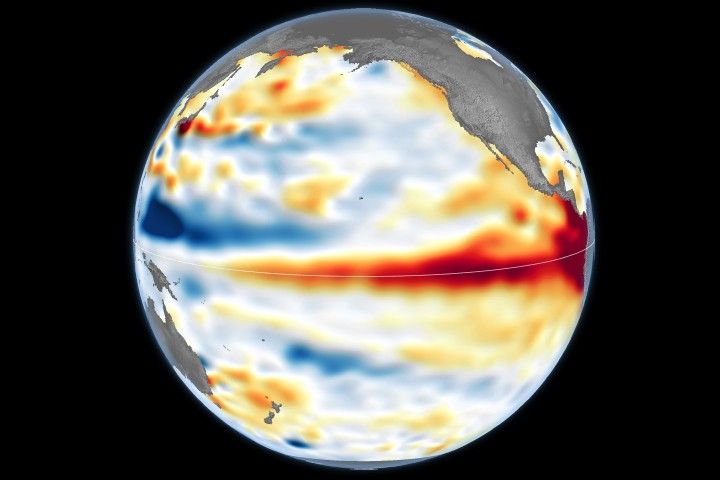
El Niño is strengthening in the equatorial Pacific, and NASA satellites are tracking warming waters, Kelvin waves, and shifting sea levels in near real time.
A climate event that can reshape weather far beyond the Pacific is taking form this fall, and NASA satellites are watching it unfold in near real time. El Niño—a recurring climate pattern that typically appears every two to seven years—develops when waters in parts of the equatorial Pacific become unusually warm. That warming can disrupt trade winds, move heat around the ocean, alter rainfall patterns, and even change sea level across large swaths of the basin.
In October, the National Oceanic and Atmospheric Administration (NOAA) estimated an 83% probability that the strongest El Niño since 1950 is now underway. The impacts are already being felt in varied ways around the world, with farmers, firefighters, and coastal communities among those most affected as regional weather shifts.
NASA’s early warning signs emerged months ago. In January 2026, satellite observations detected a Kelvin wave—an elongated surge of warm water—forming near Micronesia in the western Pacific. Kelvin waves can span thousands of miles and slowly transport heat from west to east, acting as a conduit that helps kick-start El Niño conditions. As the warmer water spreads, it heats the air above the ocean surface, encouraging that air to rise. The resulting shift in atmospheric pressure can weaken, or even flip, the trade winds that normally blow from the Americas toward Asia. When those winds slacken, warm water and elevated sea levels can build in the eastern Pacific, reinforcing the warming and accelerating the transition into a full El Niño.
By early April, NASA mapping showed the Kelvin waves reaching the eastern Pacific, accompanied by a notable increase in sea surface temperatures. Because warm water expands, it also raises local sea level—by roughly 1 to 1.3 feet (30 to 40 centimeters) in some areas. Satellite data showed this higher-than-average water pushing toward South America and then propagating north along the coastline toward California. At the same time, the western Pacific told the opposite story: sea levels around Indonesia and northern Australia appeared about 6 to 8 inches (15 to 20 centimeters) below normal.
“Kelvin waves are like the heartbeat of El Niño,” said Josh Willis, project scientist for sea level missions at NASA’s Jet Propulsion Laboratory in Southern California. “And our sea level satellites let us peer into the ocean and watch every beat.”
That view comes from satellite altimetry, a technique that has provided extremely precise measurements of ocean height continuously since 1993. The record is now being extended by the Sentinel-6 satellites, which carry advanced radar altimeters capable of surveying millions of square miles of ocean each day. These measurements complement NOAA’s network of drifting and profiling instruments and fixed buoys that sample conditions within the water column.
Temperature remains one of the clearest El Niño signatures. NASA scientists report that the eastern Pacific is already running about 3°F (1.7°C) above the long-term average, with the potential for additional warming in the months ahead. Microwave and infrared radiometers on satellites help track that heat at the sea surface, even when clouds obscure parts of the region. Throughout spring 2026, satellite maps showed the warm anomaly widening into a vast band stretching millions of square miles from the central Pacific to the South American coast.
The warming can also subtly alter the ocean’s appearance. A NASA satellite has detected measurable shifts in color, with equatorial Pacific waters becoming more blue in recent months. “Some people think of water as being just blue, but it's amazing the multitude of colors the ocean can be,” said Matthew Kehrli, a lead research scientist for NASA’s PACE (Plankton, Aerosol, Cloud, ocean Ecosystem) mission.
Why it matters
A strong El Niño can reroute rainfall and storm tracks worldwide, affecting agriculture, water supplies, wildfire risk, and coastal flooding. Satellite monitoring gives forecasters earlier, more comprehensive visibility into developing changes in ocean heat and sea level—key drivers of downstream weather impacts. With NOAA warning this could be the most intense event in decades, the next few months will be crucial for refining regional outlooks and preparedness plans.