Confusion over Pakistan policy on Taiwan airlines fuels China squeeze fears
Islamabad denied use of its airspace before abrupt reversal A passenger jet of Taiwan's China Airlines is seen at Taipei Songshan Airport.
Islamabad denied use of its airspace before abrupt reversal A passenger jet of Taiwan's China Airlines is seen at Taipei Songshan Airport.
In the United States the richest 10% now receive more than three times the income of the poorest 50%.
Read the feature →Share of pre-tax national income (pensions included), equal-split adults, 1913-2024. Drag the slider or hover the chart.
Bars show the shares in the two years and the change in points.
The richest 10% is the sum of 'richest 1%' and 'next 9%'. WID series distribute all net national income, including retained earnings and imputed rents: shares do not match declared incomes.
Source: World Inequality Database (Piketty, Saez, Zucman, Distributional National Accounts) via Our World in Data, pre-tax national income shares, equal-split adults.
Stock still slumps with investors unhappy about AI boom's dividends The world's largest memory chipmaker said on Oct.
City-state and Australia support Hegseth's proposal while the 'Squad' holds inaugural meeting U.S.
Plans to strengthen Middle Corridor with southern links as tensions reshape passageways Transport and Infrastructure Minister Abdulkadir Uraloglu says…
Proxima Fusion chief says companies moving to China over lack of cheap nuclear power Proxima Fusion in Munich is partnering with Japan's Fujikura on a…
Private equity firm and Japanese institutional investors drawn to opportunities in the asset class Taisuke Sasanuma, a co-founder of Advantage Partner…
CEO Kattiya says technology can help analyze needs, provide suitable services Kasikornbank CEO Kattiya Indaravijaya speaks during an interview in Bang…
Discover the cosmos!Each day a different image or photograph of our fascinating universe is featured, along with a brief explanation written by a prof…
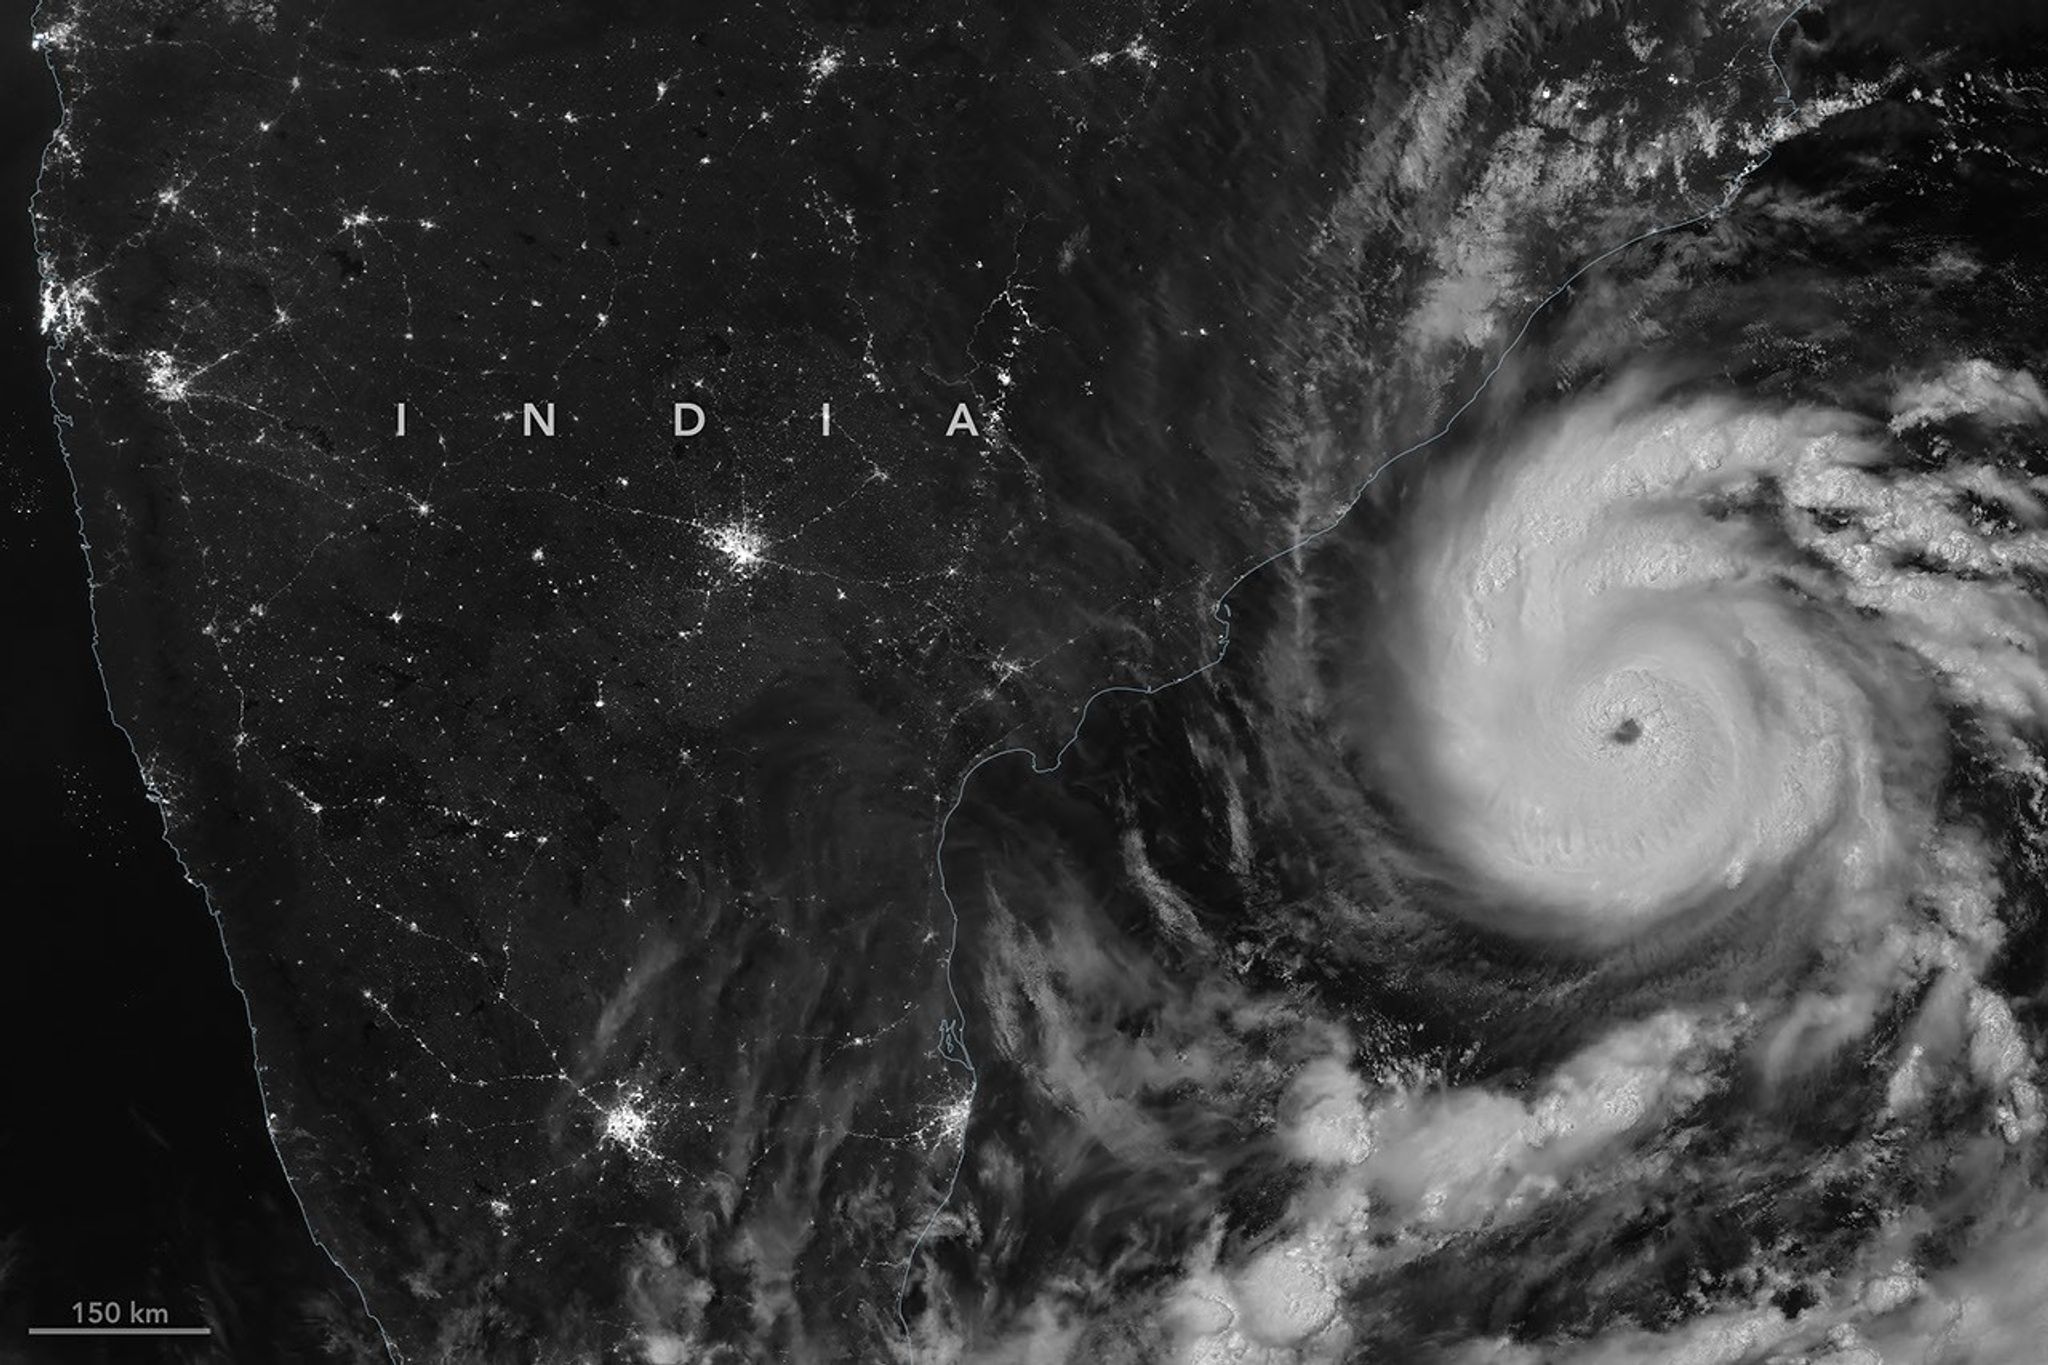
The first named storm of the North Indian Ocean’s cyclone season made landfall along the coast of Andhra Pradesh.
Japanese financial group lands another listing of historic proportions after SpaceX Mizuho's New York office.
TPUs become 'meaningful' contributor with nearly 100 customers Alphabet shares plunged more than 9% in extended trading Wednesday.
Labor scheme bolsters Moscow's war economy and Pyongyang's missile developments North Korean workers at KPP Ruskon, Moscow Oblast, in an image posted…
A long war could let militants seize territory in remote province, analysts say A border watchtower in Sistan and Baluchestan province, Iran, is pictu…
Artemis II Commander Reid Wiseman has been named Caltech associate vice president and deputy director of NASA’s Jet Propulsion Laboratory in Southern…
Consumer prices could rise next year, erasing Takaichi's consumption tax cut Prices rose for 4,965 food and beverage items in September, more than tri…